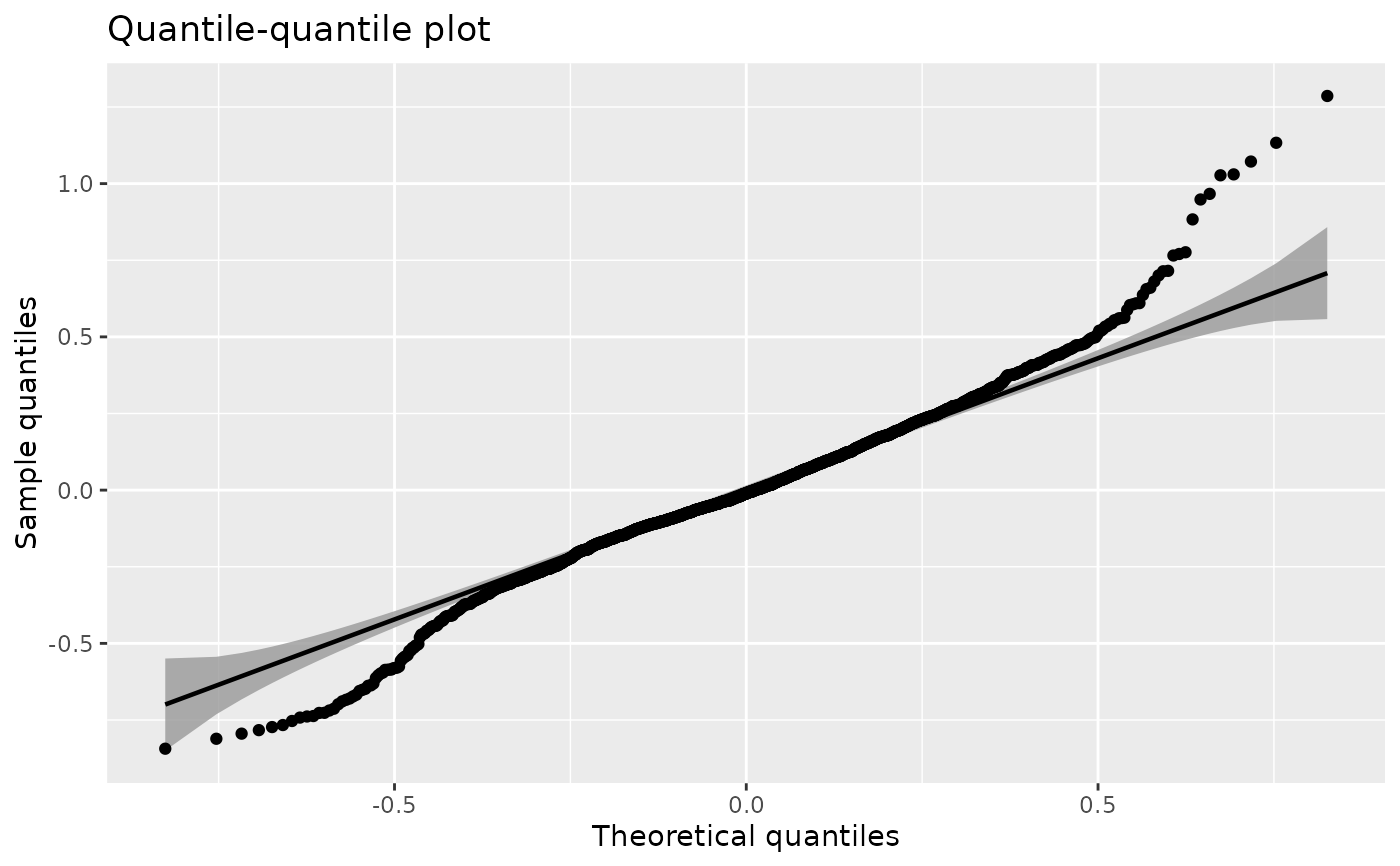
Plot the quantile-quantile (Q-Q) plot for the fitted lcModel object. This function is based on the qqplotr package.
qqPlot(model, byCluster = FALSE, ...)Arguments
- model
lcModel- byCluster
Whether to plot the Q-Q line per cluster
- ...
Additional arguments passed to residuals.lcModel,
qqplotr::geom_qq_band(),qqplotr::stat_qq_line(), andqqplotr::stat_qq_point().
Value
A ggplot object.
See also
residuals.lcModel metric plotClusterTrajectories
Other lcModel functions:
clusterNames(),
clusterProportions(),
clusterSizes(),
clusterTrajectories(),
coef.lcModel(),
converged(),
deviance.lcModel(),
df.residual.lcModel(),
estimationTime(),
externalMetric(),
fitted.lcModel(),
fittedTrajectories(),
getCall.lcModel(),
getLcMethod(),
ids(),
lcModel-class,
metric(),
model.frame.lcModel(),
nClusters(),
nIds(),
nobs.lcModel(),
plot-lcModel-method,
plotClusterTrajectories(),
plotFittedTrajectories(),
postprob(),
predict.lcModel(),
predictAssignments(),
predictForCluster(),
predictPostprob(),
residuals.lcModel(),
sigma.lcModel(),
strip(),
time.lcModel(),
trajectoryAssignments()
Examples
data(latrendData)
method <- lcMethodLMKM(Y ~ Time, id = "Id", time = "Time", nClusters = 3)
model <- latrend(method, latrendData)

if (require("ggplot2") && require("qqplotr")) {
  qqPlot(model)
}
#> Loading required package: qqplotr
#>
#> Attaching package: ‘qqplotr’
#> The following objects are masked from ‘package:ggplot2’:
#>
#>     StatQqLine, stat_qq_line